Experiment snapshot:
Full-grid exploratory mapping is complete.
Two fixed models scored the numeric-valid cells in the supplied Mandi image grid. Comparison with Tanvi's actual detector remains unrun.
Inspect the four exploratory maps- Grid cells processed
- 80,628,232
- Numeric-valid cells scored
- 46,230,961
- Cells excluded by numeric-data rules
- 34,397,271
57.3384% is numeric coverage, not accuracy. The denominator is the entire rectangular supplied grid, including its masked outer footprint. It is not the fraction of Mandi district covered.
No independent, fully reviewed image area with both landslides and non-landslides was available. These maps do not establish landscape accuracy, superiority to the original rules or early warning. Read the limits.
Three stages, with different questions.
-
Original rules and manual review
Tanvi's original method used vegetation change between image periods and slope rules to generate candidates for a person to inspect. It was not trained ML. The exact rule implementation was not recovered for this experiment.
-
Earlier candidate-level paper
The paper compared ML using centre features (C0) with ML adding neighbourhood context (C1). Both were four-model ensembles, not Tanvi's baseline. Results depended on the label reference.
-
Current supplied-image mapping
Two fixed LightGBM models used centre features to score the available grid under CSV and polygon labels. This completed the exploratory computation within the fixed supplied inputs, not a detector comparison.
What the earlier paper found.
C0 used 45 centre features; C1 used 315 features including neighbourhood context. The four-model ensembles combined Logistic Regression, Random Forest, XGBoost and LightGBM. These results concern the selected candidate list.
| ML input | Weighted AP |
|---|---|
| C0: centre | 0.7604 |
| C1: context | 0.7955 |
Average precision (AP) summarizes how well positive labels appear ahead of zero labels across the ranking. The AP gain was 0.0351, with a conditional 95% spatial-cell interval of [0.0155, 0.0532].
At the same fold-allocated 427-check budget, C0 retrieved 339 positive labels and C1 365: 26 more. Precision rose from 79.4% to 85.5%; candidate recall rose from 28.7% to 30.9%. This is not district recall or a future-event guarantee.
The polygon reference changed the finding
When trained and evaluated against polygon membership, C0 AP was 0.6433 and C1 AP 0.6394. The change was -0.0039, interval [-0.0245, 0.0154]: no clear context gain under this reference.
CSV and polygon references disagreed on 719 of 2,120 candidates (33.9%). Those are disagreements, not proven label errors. Neither reference is independent full-area physical truth. Repeated exploratory use of one historical inventory limits the finding.
Which inputs the earlier paper relied on
In the earlier 315-feature C1 ensemble, shuffling the whole optical family produced the largest held-out AP drop under both references: 0.1014 for CSV and 0.0602 for polygon. This is a 238-column family, not NDVI alone. Group size and correlation affect this diagnostic; it does not establish causation, unique contribution or importance in the current 45-feature maps.
What ran on the supplied images.
Exactly two fixed LightGBM models, each with 400 trees and seed 42, were fitted on all 2,120 candidate rows. Both used the same 45 centre features from 33 supplied rasters. There were no context windows in this fit.
| Training target | Positive | Zero |
|---|---|---|
| CSV Class | 1,181 | 939 |
| Polygon membership | 1,182 | 938 |
A polygon positive includes points on the inventory boundary; zero means not mapped in that inventory. These zero labels do not establish independently reviewed non-landslide terrain outside the selected candidates. CSV versus polygon is label-reference sensitivity, not two detector methods.
All 1,258 tiles of the 9,406-row by 8,572-column native grid were processed: 80,628,232 cells, of which 46,230,961 were scored and 34,397,271 excluded.
Numeric validity means the required source values and derived features met the declared numeric-data rules, including the flat-slope aspect exception. It is not a cloud, snow, water or image-quality mask.
The prediction code imposed no additional candidate, slope or vegetation filter. Original export, mask and earlier-screen provenance remain UNKNOWN. Broad computation does not prove the supplied exports were unfiltered or give candidate-trained ML independent full-area truth.
The mean absolute CSV-versus-polygon score difference was 0.169824; the signed mean, CSV minus polygon, was +0.101007. These measure sensitivity of uncalibrated classifier scores to the label reference. They are not accuracy, physical risk, ML-versus-rules error or proof that one reference is right.
Four exploratory views.
Not independently validated. These 1,400 by 1,100 PNG previews use downsampled display blocks. Score panels average only numeric-valid scores within each block; the companion panel shows its numeric-valid fraction. The retained scientific rasters keep the native grid. A display block is not one native cell.
Open each full-resolution PNG to inspect its legends and warnings. Scores are uncalibrated class-1 outputs, not physical landslide probabilities.
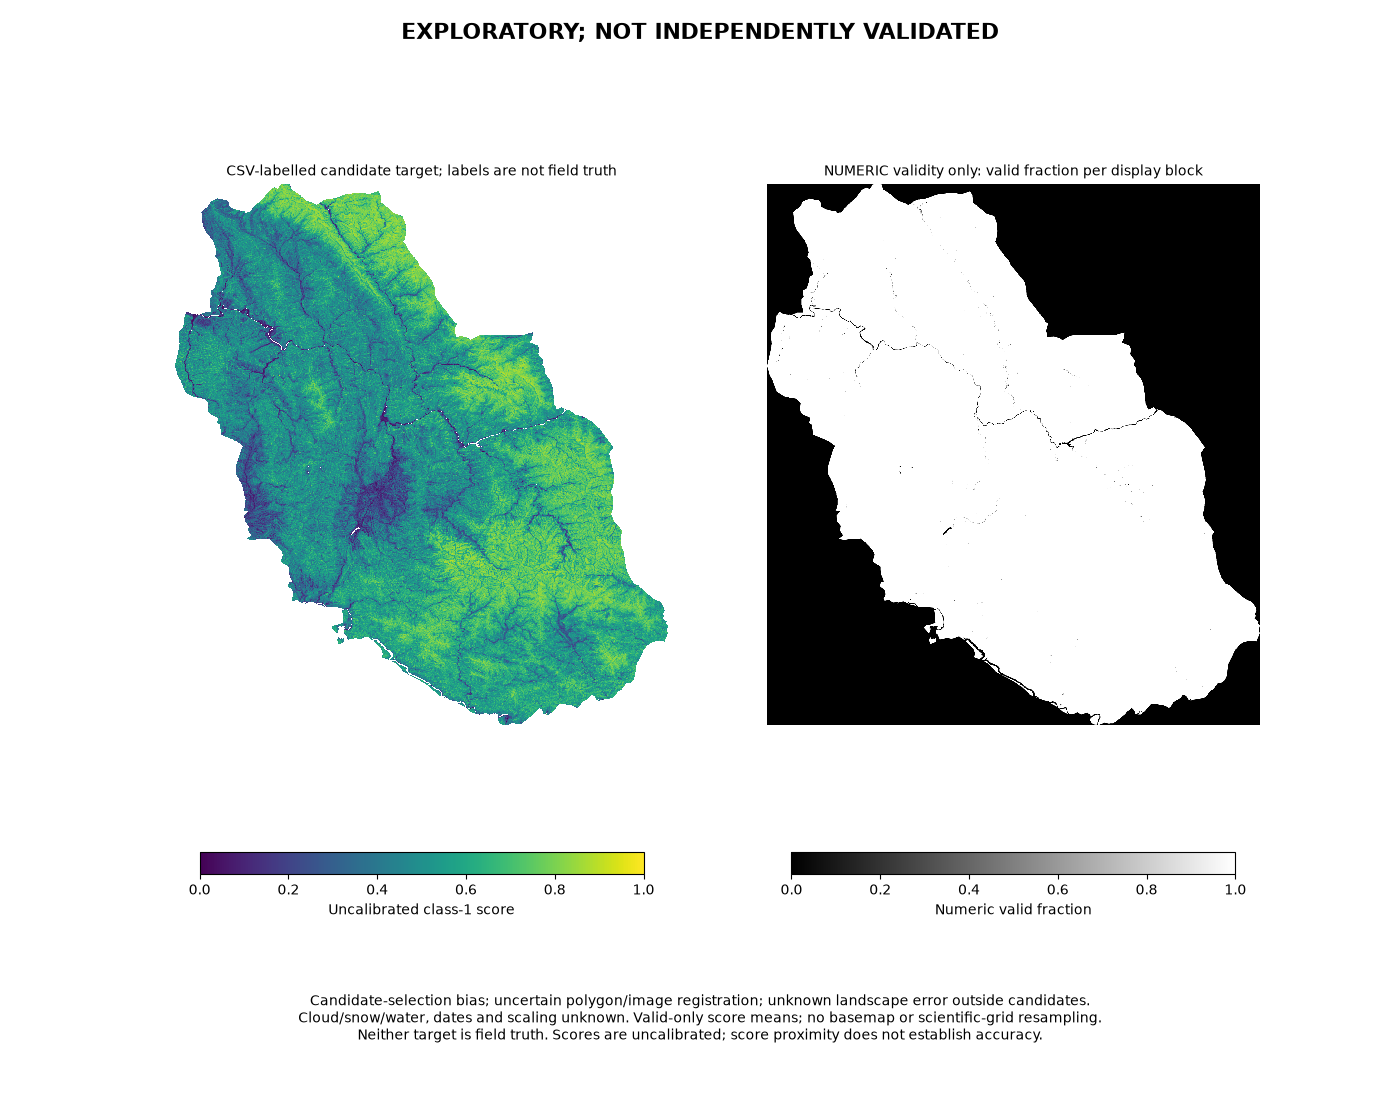
CSV-target score. Exploratory preview, not independently validated as a landslide map. Learned from the candidate CSV Class labels. Higher values mean a higher class-1 score under that reference, not confirmed landslides.
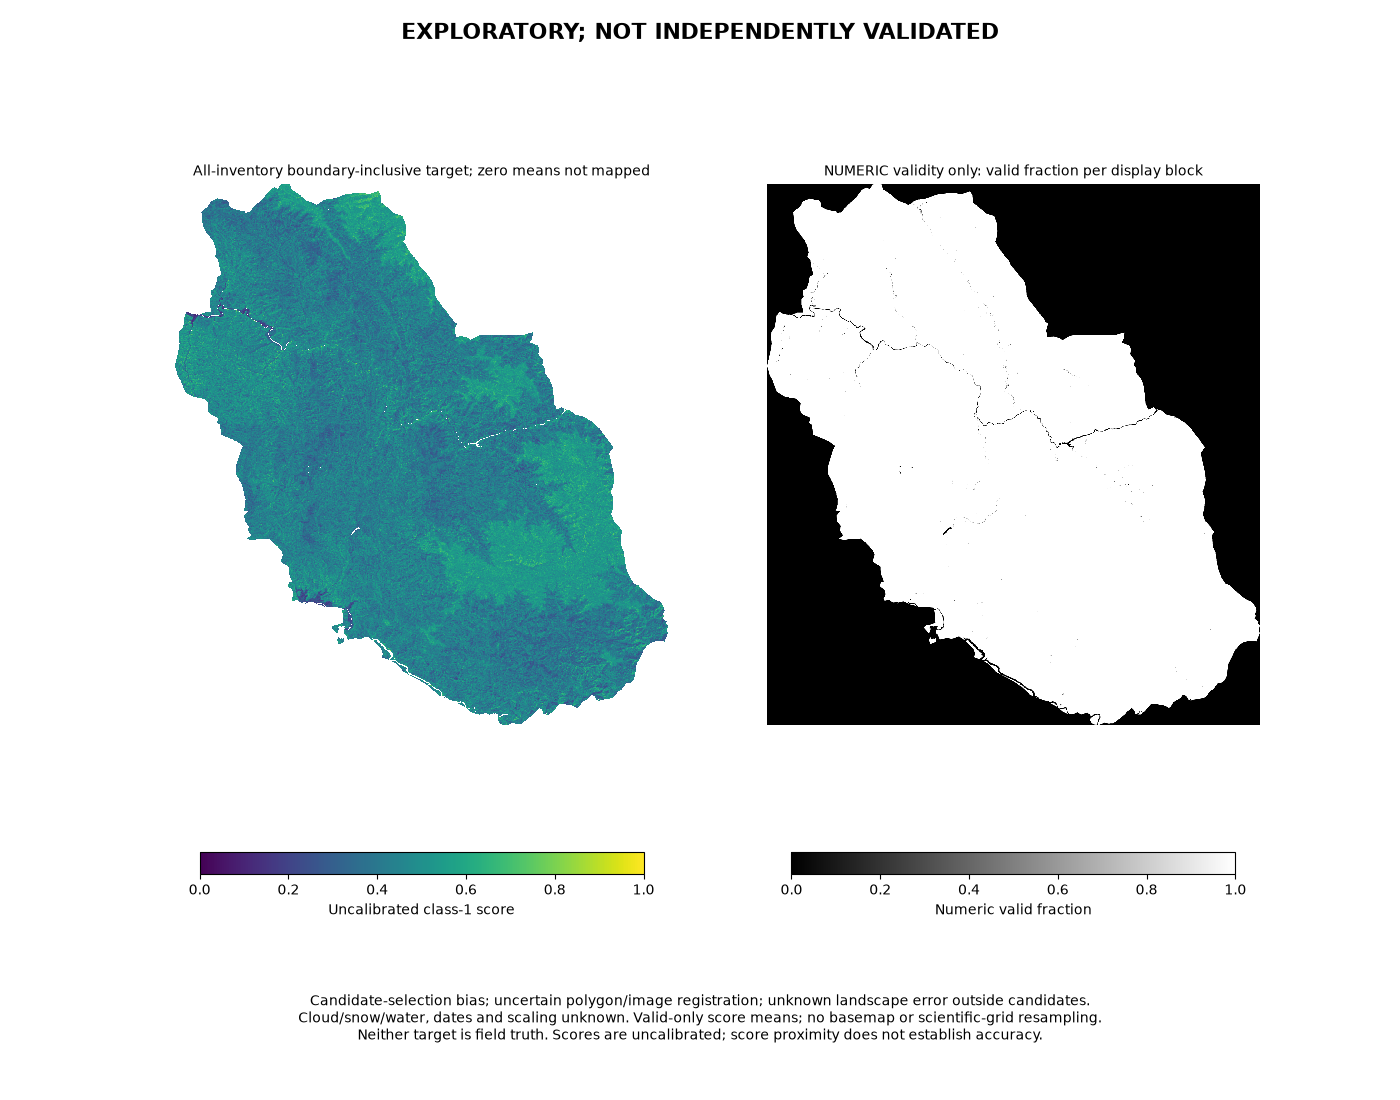
Polygon-target score. Exploratory preview, not independently validated as a landslide map. Learned from boundary-inclusive membership in the supplied inventory. Not mapped does not mean independently confirmed non-landslide.
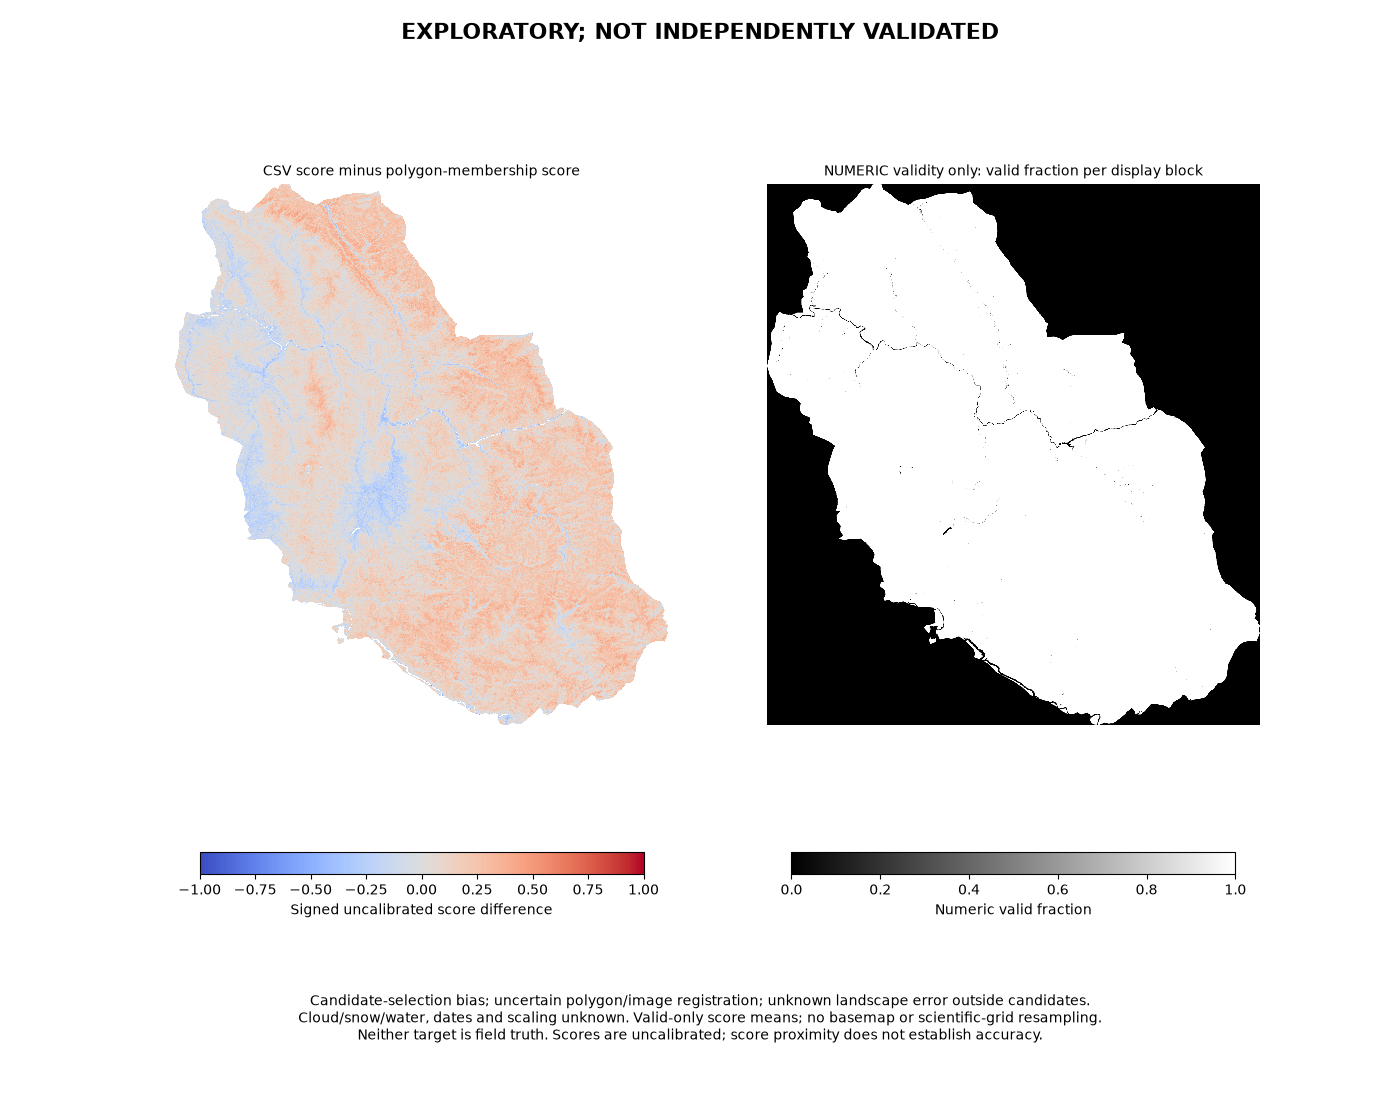
Score difference: CSV minus polygon. Exploratory preview, not independently validated as a landslide map. Positive values mean the CSV-target model scored higher; negative values mean the polygon-target model scored higher. This shows label-reference sensitivity, not which model is correct.
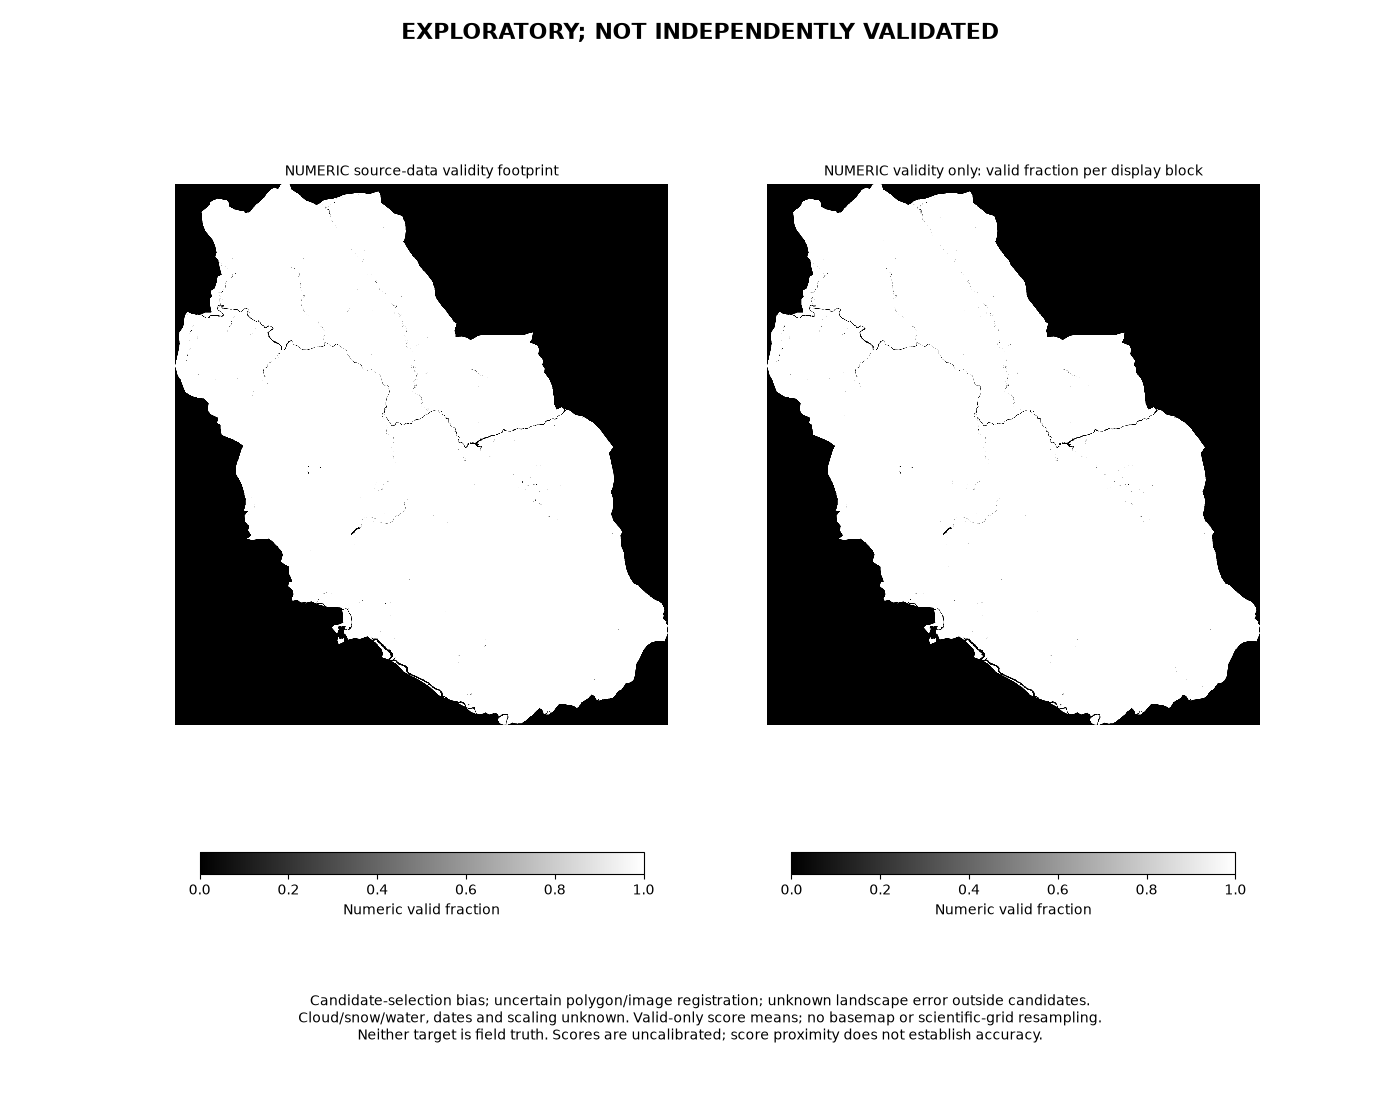
Numeric-data validity. Exploratory preview, not independently validated as a landslide map. Shows where numeric-data rules allowed scoring. Excluded score cells have no score; the separate validity raster records zero there. This is data availability, not image quality or detection accuracy.
What the current models look at.
These are accessible interpretations of the supplied features, not proved physical causes or a new importance ranking.
- Terrain and drainage
- Elevation, slope, aspect, ground shape, roughness and drainage measures describe where a cell sits. Height above drainage (HAND) may help distinguish a riverbed from higher hillside ground; steepness alone cannot confirm a landslide.
- Optical bands
- Colour and infrared measurements describe the surface in the supplied Pre/Post image periods. Different surfaces can look different, but similar colours can also have different causes.
- Vegetation, bare soil and changes
- Indices such as NDVI summarize greenness; other indices describe bare soil or moisture-related signals. Changes between the supplied periods may highlight exposed ground, but construction, river changes and erosion can resemble a scar.
Background: NASA on vegetation indices and USGS on landslide terrain.
Fixed supplied inputs only. Roads, lineament density and land-use layers were not recovered from the supplied material and were not run inputs. Rainfall was deliberately excluded from the experiment. No replacement public layers or rainfall experiment were added.
What remains unproved.
Source timing is unverified. Pre/Post are supplied file/period designations only. Acquisition-to-event chronology is unverified, so these are not confirmed before-event/after-event images and do not establish forecasting or dated advance warning.
No faithful executed Tanvi baseline. The actual rule implementation was unavailable in the supplied material, so direct ML-versus-rules comparison remains unrun.
No independent, fully reviewed image-area reference. Both landslides and non-landslides would need review across an area to measure landscape accuracy, false alarms and missed landslides. Candidate-trained scores do not supply that truth.
No demonstrated ML superiority, calibrated physical probability or early warning. Candidate-selection bias, uncertain polygon/image registration and unknown source-quality history limit interpretation. Reproducible computation does not resolve those uncertainties.
Reproducible computation.
The checks support computational consistency of this supplied-input experiment. They do not measure physical detection accuracy.
What was verified
- All 2,120 candidate rows and 45 source-derived features were replayed: 95,400 comparisons, zero mismatches.
- Two fitted checkpoints were retained and reloaded with zero score replay error. Pilot stop/resume preserved the same fits without refitting.
- Full-grid checks covered numeric domain, score ranges, grid alignment, excluded cells, signed differences and the complete 1,258-tile ledger.
- 15 direct-cell comparisons had zero error: five numeric-valid and ten invalid cells. Selected corner and tile-edge samples were invalid; there is no valid-edge direct-sample assertion.
- Completion was recorded only after successful processing and confirmed process exits. Finalized scientific output bytes were bit-identical to the verified outputs.
The four public PNGs are display previews of those retained native-grid outputs. Private source data, candidate tables and model files are not part of this public explainer.